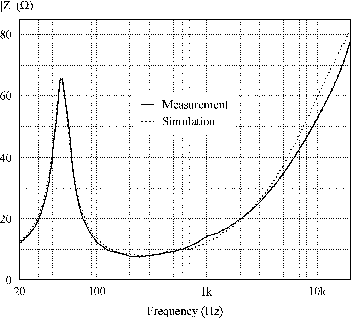
Next, the frequency dependency of the electrical input impedance was considered. As can be seen in Figure 5, good agreement between simulation results and measured data was achieved.
 |
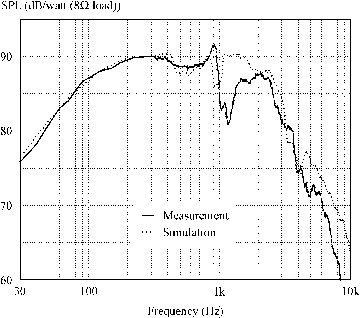
After these basic validations of the computational model, the axial
pressure response of the electrodynamic loudspeaker was measured and
compared with simulations.
The input level is a nominal 1 W referred to 8 ![]() (2.83 V
r.m.s.) with the microphone placed on the mid axis at a distance of 1 m
from the loudspeaker.
The loudspeaker was driven from an amplifier representing a
voltage source and to ensure the validity of the comparison of computed
and measured sound pressure levels, the moving coil driver was mounted
in a 5.1 m
(2.83 V
r.m.s.) with the microphone placed on the mid axis at a distance of 1 m
from the loudspeaker.
The loudspeaker was driven from an amplifier representing a
voltage source and to ensure the validity of the comparison of computed
and measured sound pressure levels, the moving coil driver was mounted
in a 5.1 m ![]() 3.4 m baffle. This baffle
was placed in an anechoic chamber to achieve the desired radiation in a half-space. To avoid the acoustic shortcircuiting-effect for low frequencies the baffle has to be enclosed by the walls of the chamber. Furthermore, due to the large back volume the additional stiffness component of the back air volume can be neglected.
Again good agreement between simulation
and measurement was observed (see Figure 6).
3.4 m baffle. This baffle
was placed in an anechoic chamber to achieve the desired radiation in a half-space. To avoid the acoustic shortcircuiting-effect for low frequencies the baffle has to be enclosed by the walls of the chamber. Furthermore, due to the large back volume the additional stiffness component of the back air volume can be neglected.
Again good agreement between simulation
and measurement was observed (see Figure 6).
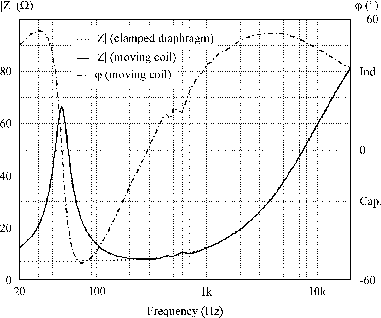
Figure 7 shows the calculated modulus and phase response of the electrical input impedance for clamped and moving diaphragm. The total current
![]() in the conductors of the moving coil can be described by [10]
in the conductors of the moving coil can be described by [10]
At very low frequencies, the first term of the right-hand side of equation (12) is dominant and represents the resistance of the voice coil. For frequencies f in the range 20<f<200 Hz, the cone motion gives rise to a corresponding current in the coil. This is the motional emf and can be described by the dominant third term of equation (12). Due to the movement of the conductive coil in the magnetic field of the permanent magnet, eddy currents will be induced and cause a significant increase of the impedance magnitude, while passing through inductive, resistive and capacitive regions [9]. For frequencies above the fundamental resonance, where the loudspeaker is under mass control, the motional emf-term is still dominant and, therewith, the impedance becomes capacitive. At higher frequencies, the second term of the right-hand side of equation (12) becomes significant. This term corresponds to the inductance of the voice coil and causes the increase of impedance and, therewith, a more inductive phase. Above 1000 Hz, eddy currents induced in the magnet assembly reduce the voice coil inductance and, therefore, the phase becomes more resistive (instead of
![]() for ideal coils) [12].
for ideal coils) [12].
In the computer simulations of the electrodynamic loudspeaker, approximately 25.000 second order finite elements have been used, resulting in a total number of about 100.000 unknowns. On a SGI, Octane 195 MHz the calculation of a transient analysis with 10.000 time steps required 8 hours of CPU-time and 256 MB of physical memory.